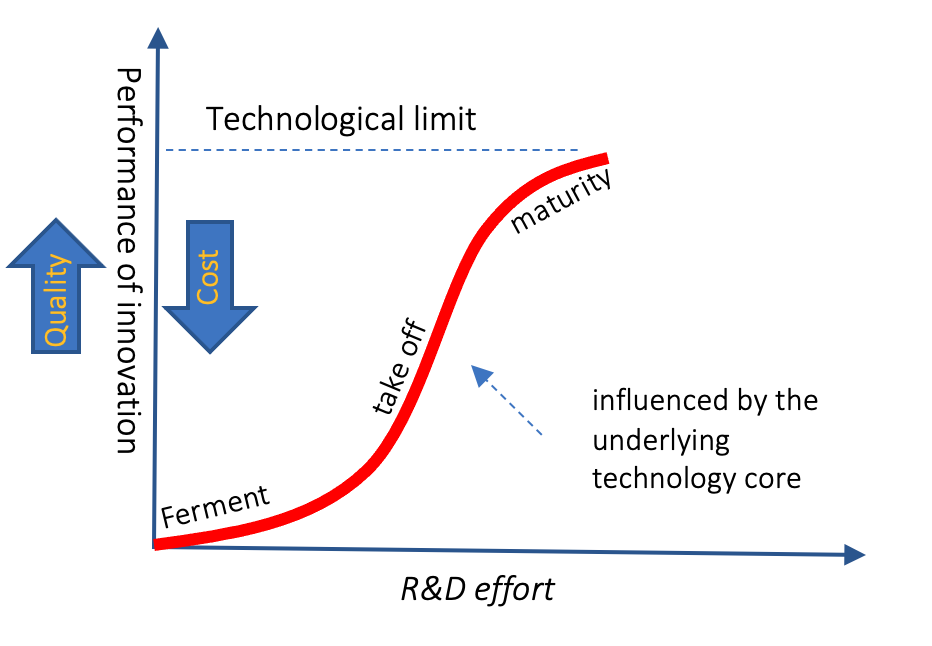
Innovation S-curve refers to the formation and growth of innovations reaching maturity through a non-linear S-curve life cycle. Like human beings, upon birth, innovations keep evolving through stages. The evolution takes place because of (i) the advancement of the underlying technology core, (ii) the progressive revealing of user requirements, (iii) unfolding externalities, (iv) the availability of complementary technologies, and (v) competition. Along the path of evolution, quality keeps going up, and costs keep falling. As a result, innovation adoption also takes the shape of an S-curve. However, the innovation evolution path reaches maturity, leading to reinvention and discontinuity. The change of technology core forms the reinvention wave. Despite inferior emergence, it evolves and takes the form of Schumpeter’s creative destruction. Due to the switching failure from a mature wave to an emerging one, incumbent firms sometimes suffer from disruptive effects, turning creative destruction into Disruptive innovation. Consequentially, innovation lifecycles evolve through multiple S-curves in an episodic form.
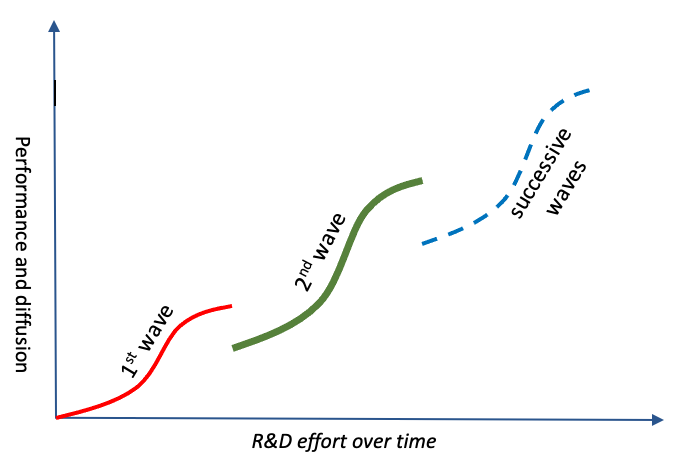
Upon analyzing data of 17 industries in 1971, Fisher was the first to come up with the concept of the S-curve theory in explaining the dynamics of technological innovations. Despite variations of innovations’ evolution, the innovation S-curve is a valuable reference model. Regarding time and effort, it helps us visualize the relation of performance improvement over time. Consequentially, it assists us in determining the level of maturity and predicting R&D productivity. Furthermore, to avoid disruptive consequences due to innovators’ dilemmas, managers can derive insights about the likelihood of the emergence of a reinvention wave—creating discontinuity. As the quality and cost keep changing with the innovation evolution, this S-curve model helps us to synchronize marketing efforts. Hence, the innovation S-curve becomes a vital tool in evaluating a product or an industry. Understanding their position on the S-curve is beneficial to assess the possible opportunities, risks, and pitfalls associated with specific phases.
Purpose and benefits of innovation s-curve
- The purpose is to model the dynamic life cycle of innovations to offer a reference model so that management, investors, Startups, and policymakers can rationalize their interventions. However, treating the S-curve as the universal truth about the life cycle of innovations risks an inappropriate understanding of reality, leading to erroneous predictions and wrong decisions.
- The benefits of innovation S-curve include:
- a reference model for monitoring and predicting innovations for (i) identifying growth opportunities, (ii) assessing competitors’ responses, and (iii) developing marketing strategies.
- a guide to (i) track progress, (ii) compare growth and adoption rates, and (iii) forecast future growth.
Despite the simplicity, the innovation S-curve is a good representation of the dynamic life cycle of innovations. The innovation S-curve offers significant benefits to comprehending dynamics, predicting future growth, and detecting the trend of saturation of technology innovations for rationalizing investment and policy decisions.
Key takeaways of innovation s-curve:
- Dynamic life cycle–innovations are not static; they are born in embryonic form and keep growing, reaching saturation. However, the non-linear growth cycle takes an S-curve-like shape.
- Growing performance–along with the growth, the performance of innovations keeps improving.
- Continued R&D need–for growth, innovations need a Flow of Ideas as growth ingredients, demanding continued R&D for refinement of technology and consumer preferences.
- Maturity–irrespective of greatness, all innovations reach saturation, slowing revenue growth.
- Successive waves–to overcome maturity, innovators need to embark on the next wave around emerging technology core. However, often, innovators face decision dilemmas, resulting in suffering from disruptive consequences.
Research questions about innovation s-curve:
Innovation management faces significant challenges as real-life innovations do not exactly follow an idealistic S-curve-like life cycle. Hence, there have been many research questions about innovation S-curves and their usage as a guide to predict and make decisions.
- Universality of s-curve–a highly simplified representation of the dynamic life-cycle of innovations takes an S-curve-like shape. Certainly, the reality has infinite variations. Hence, the life cycle of every innovation demands careful monitoring and prediction.
- Facing chasm— innovations risk a pause of growth or intermediary stunting, resulting in getting caught in the chasm. Often, major scientific discoveries are needed to cross the chasm. However, scientific discoveries do not always succeed in resuming from pause.
- Predicting the growth–despite having an S-curve-like shape, depth and breadth vary. Besides, R&D productivity in fine-tuning technology, sharpening the understanding of consumer preferences, advancing performance, and creating the willingness to pay also varies. Such variations create decision-making challenges in managing innovations.
- Successive waves–despite their necessity, successive waves do not naturally flow. Each next wave necessitates an emerging technology core, demanding scientific discoveries. Not all the candidate emerging technologies succeed in fueling successive waves, posing a decision-making challenge.
- Precursor of graduating from infancy–-taking off from infancy or ferment state does not happen naturally. It requires revealing underlying science, detecting latent consumer preferences, connecting to diverse ecosystem partners, and synchronizing to externalities like infrastructure, standards, and policies.
Content of the remaining part of the article:
- Significant phases of innovation S-curve
- Examples of innovation S-curve
- The lifecycle of music innovation spells out as a series of innovation S-curve
- Innovation S-curve and adoption pattern
- Underlying forces or factors driving innovation evolution forming innovation lifecycle
- Innovation S-curve unfolds as sustaining innovation strategy
- Discontinuity, Schumpeter’s creative destruction and disruptive innovation in the innovation lifecycle
Major phases of innovation S-curve:
Three major segments of innovation S-curve are (i) Ferment, (ii) Takeoff, (iii) Maturity. But the maturity state of the innovation is followed by a reinvention wave due to a change of mature technology core with emerging one. Hence, a discontinuity state is created—the fourth stage. It’s the interface between successive innovation S-curves forming the innovation lifecycle. Due to the varying nature of opportunities and risks, innovators face the challenge of adapting strategic responses with these maturity stages. Hence, estimating the S-curve’s position is crucial in management decision-making. For example, the incremental advancement strategy at discontinuity may be extremely harmful—running the risk of facing Kodak Moment.
On the other hand, premature reinvention moves to change the technology core may end up failing to overcome the threshold level. For example, the premature move of using the WiMax technology to reinvent cellular telecommunication led to a catastrophic loss to innovators like equipment makers (Intel), operators, and early adopters.
Let’s look into the Y-axis, quality keeps going, and the cost keeps falling. What are the underlying factors in producing this seemingly conflicting result? This improvement does not happen from mere experience, techniques like 6 Sigma, design thinking, TQM, and more adoption by customers. It demands a systematic flow of ideas from empathy, Passion for Perfection, technology possibilities, and externalities. In many cases, it requires systematic scientific investigation to advance the underlying technology core. In the end, the technology lifecycle having S-curve-like patterns unfolds as innovation S-curve. Hence, there is a strong parallel between the lifecycles of innovation and the lifecycle of the underlying technology core.
Ferment:
This is the beginning of the S-curve pattern of innovation. At the ferment stage, new products get born. Many innovators get busy innovating products around the newly emerged technology core. For the automobile, this was the era of the 1890s. The 1980s was the fermentation era of word processors. During the fermentation stage, the product is primitive, the cost is high, and the industry has insignificant market power. But in some instances, due to primitive emergence, there could also be only a few customers and producers. For example, IBM was the only maker of hard disks in the 1950s. Hence, despite the potential and low competition, due to primitive emergence, often, innovators suffer from loss. The primary reason is the high cost and low willingness to pay for a poor-performing product.
Take off:
Upon crossing the ferment stage, innovations start revealing latent potential, in terms of rapidly increasing quality and decreasing cost. As a result, innovations start diffusing in the early majority and late majority segments. However, as identified by Geoffrey Moore, innovators need to cross the chasm. Due to the growing market and profit-making opportunity, the competition gets intensified. The race of releasing successive better versions to capture market share leads to the emergence of dominant producers with the capability of offering the highest quality at the least cost. Hence, market power accumulation also keeps growing along with the proceeding toward maturity.
Maturity:
Slow performance growth, decreasing R&D productivity, and growing mergers and acquisitions indicate reaching the maturity stage of the innovation S-curve. Hence, growing Monopolistic market power and stagnancy in innovation are indications of maturity. For example, Kodak’s monopoly in the 1970s and rapidly disappearing hard disk makers in the 2010s were indications of the maturity of innovation S-curve in the respective industry. At this stage, cost-cutting from Process innovation and outsourcing for labor cost reduction get the priority.
Discontinuity:
At the maturity stage, the availability of emerging technology core having the potential of finding alternatives encourages reinvention. For example, LED, optical compact disk (CD), and electronic image sensors encouraged innovators to reinvent light bulbs, music players, and cameras in the 1980s. Similarly, LCD, GUI, and multitouch technologies inspired the reinvention of the display, the computer user interface, and the smartphone. Consequentially, the maturity of the current innovation S-curve is followed by a reinvention wave, creating discontinuity. However, they appear in primitive form, irrespective of their greatness, creating innovators’ dilemmas. Sometimes, those reinvention waves grow as creative destruction. Ironically, managers of incumbent firms often suffer from innovators’ dilemmas and fail to switch. As a result, they suffer from the burn of disruptive innovation. Hence, due to decision-making errors during the discontinuity phase, once-dominant firms disappeared by giving growth of opportunities of new entrants.
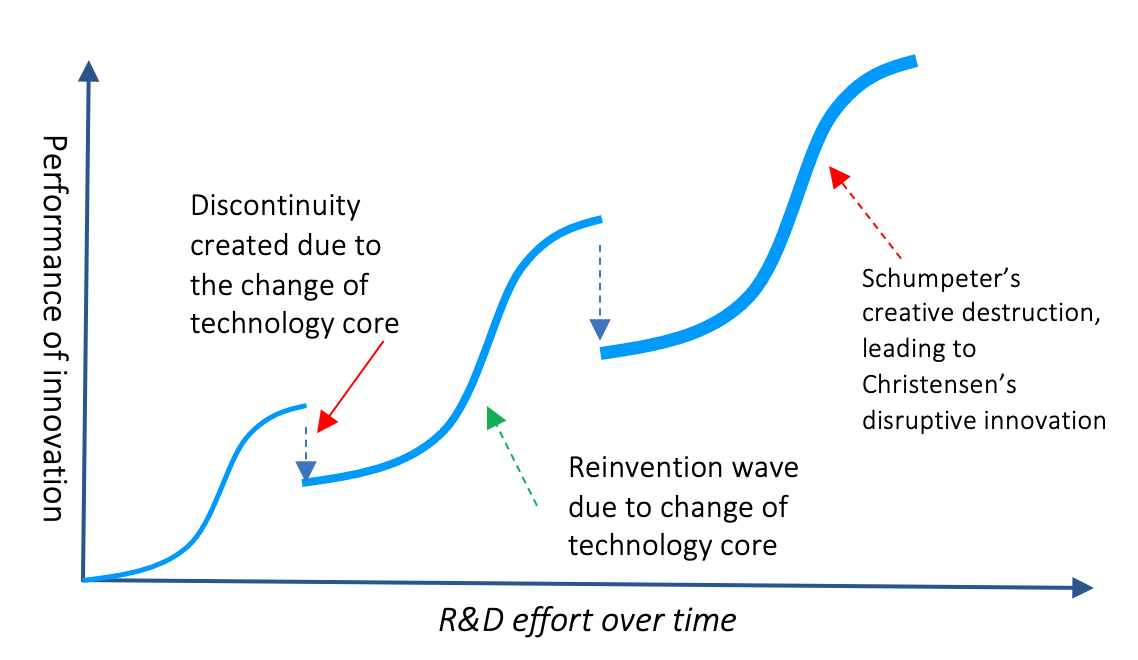
At each discontinuity, many dominant giants disappeared due to their thinking that the upcoming technology was too much behind; it would never catch up. In addition to avoidance, they show the tendency to create resistance. By the time the reinvention wave out of new technology core becomes comparable in performance and cost – the incumbents of older “S” curves remain far too far behind. The underlying cause has been the weak understanding of the evolution of innovation as successive innovation S-curves. Due to it, despite having enormous technology capability, funds, and many other resources, they ultimately face the Kodak moment. On the other hand, it’s a massive opportunity for new entrants, whether firms or countries. This knowledge should be at the core of deriving value from technology possibilities in advancing innovations, firms, industries, and countries.
Examples of innovation S-curve–unfolding creative destruction waves
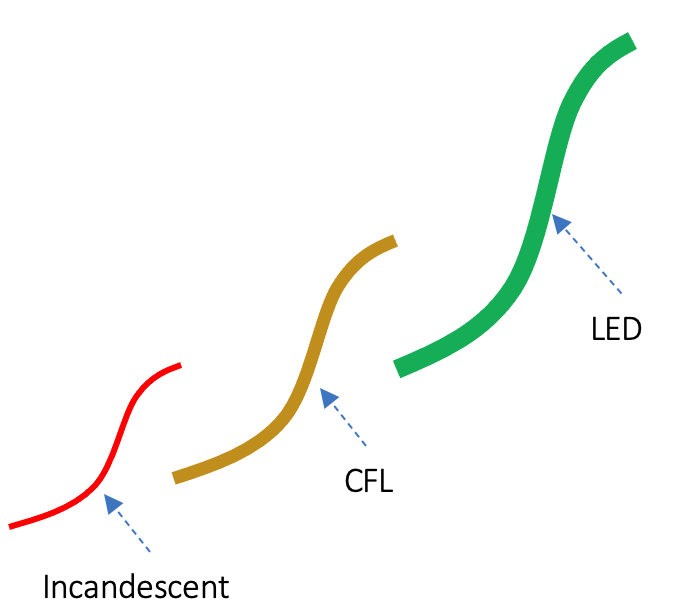
Notable examples of innovation S-curves are digital cameras, word processors, solid-state disk drives, LED light bulb, iPhone, iPod, and many more. They are the stories of creative destruction and disruptive innovation out of discontinuity. Sometimes, they contribute to the formation of long-run innovation waves.
For example, in the 1980s, incandescent light bulbs and CFL reached maturity, creating the opportunity of discontinuity out of reinvention. Hence, Nichia took advantage of it by pursuing the LED reinvention wave, and GE suffered from a disruptive effect. Similarly, Kodak suffered from disruption due to the uprising of creative destruction of digital cameras. On the other hand, Amazon has succeeded in reinventing books through eBooks and Kindle. To get further clarity, let’s look into the music industry’s evolution from cassette tape to streaming.
Innovation S-curves of the music industry:
The award of U.S. Patent No. 200,521 to Edison for his invention—the phonograph—on February 19, 1878, gave birth to music recording and playback innovation. However, its acoustic technology core did give much room for incremental advancement. Subsequently, Western Electric reinvented it by changing the mechanical technology core with electric in the 1920s. This evolution journey continued leading to the magnetic music cassette tape era of the 1960s.
To get further clarity about the innovation S-curve, let’s focus on the evolution of music recording and playback innovation. In the 1960s, a Philips team led by Lou Ottens invented cassette tape. This was the ferment era of music cassette tape innovation. In the 1970s, it took off with Sony’s Walkman in response to customers’ demand to listen to their Cassette outside. Subsequently, the profit-making opportunity shown by Sony witnessed competition from Phillips, TDK, Maxwell, etc. As usual, in the 1980s, the evolution of music cassette tapes through incremental advancement reached maturity, followed by discontinuity.
The invention of compact disk (CD) technology by Sony and Phillips led to the discontinuity phase as the reinvention wave due to the change from cassette tape to CD emerged. Yes, it formed a new wave, which grew as creative destruction and disruptive innovation.
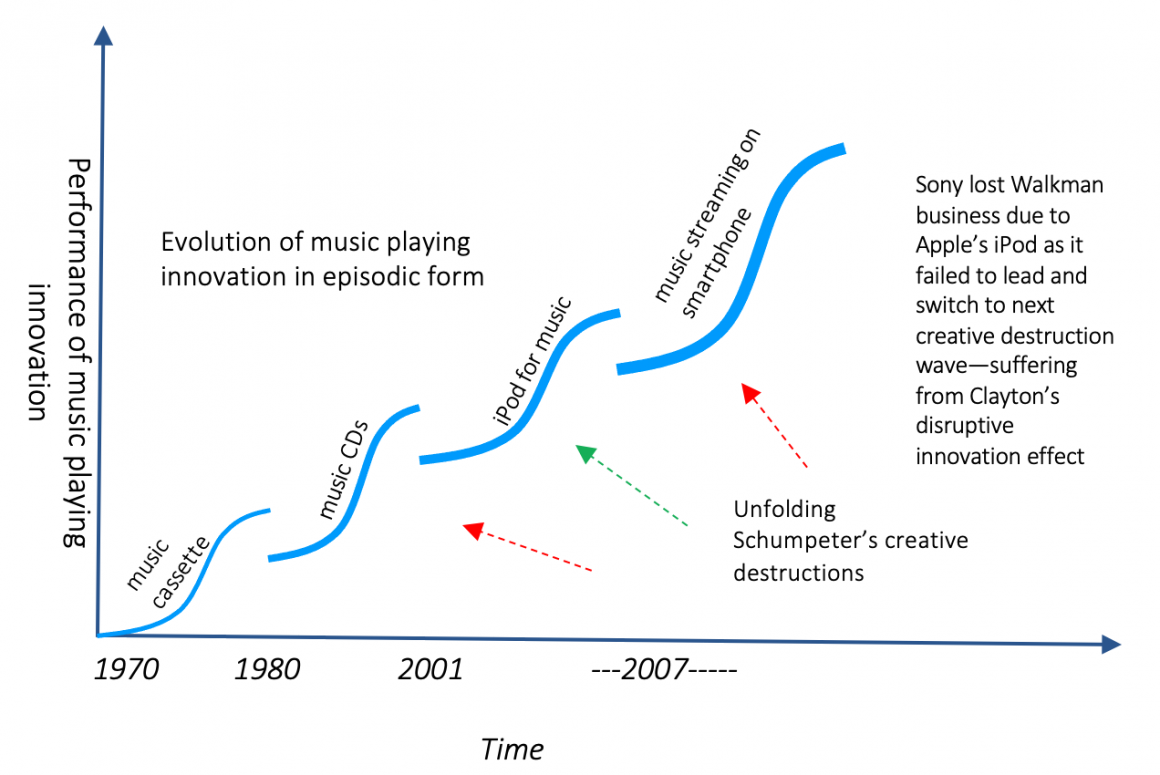
Subsequently, music innovation S-curve of music CD reached maturity, and iPod out of MP3 and Internet technology core emerged, creating discontinuity. This iPod creative wave turned into disruptive innovation, causing destruction to Sony’s portable music business. The evolution of the music innovation lifecycle continued with another phase of discontinuity created by the streaming services. In the end, the innovation lifecycle comprises a series of innovation S-curves forming the episodic model.
Innovation S-curve and adoption pattern:
There are five categories of customers such as (i) innovators, (ii) early adopters, (iii) early majority, (iv) late majority, and (v) laggards. Adoption of innovation by different customer categories varies with the S-curve-like evolution. At the beginning of the innovation S-curve, products are of poor quality and expensive. Customers having a special need find them helpful. Customers of primitive emergence of innovation belong to the innovator category. In the case of hard disk, Internet, and airplane, the military belonged to this category. Prof. Clayton called it a non-consumption segment. The advancement in quality and cost makes the innovation attractive to the next group, early adopters.
Further progression is needed for the innovation to diffuse through the early and late majority segments. Eventually, at the maturity stage, laggards adopt the innovation. Such diffusion patterns through different successive customer segments along the path of innovation S-curve should be carefully considered.
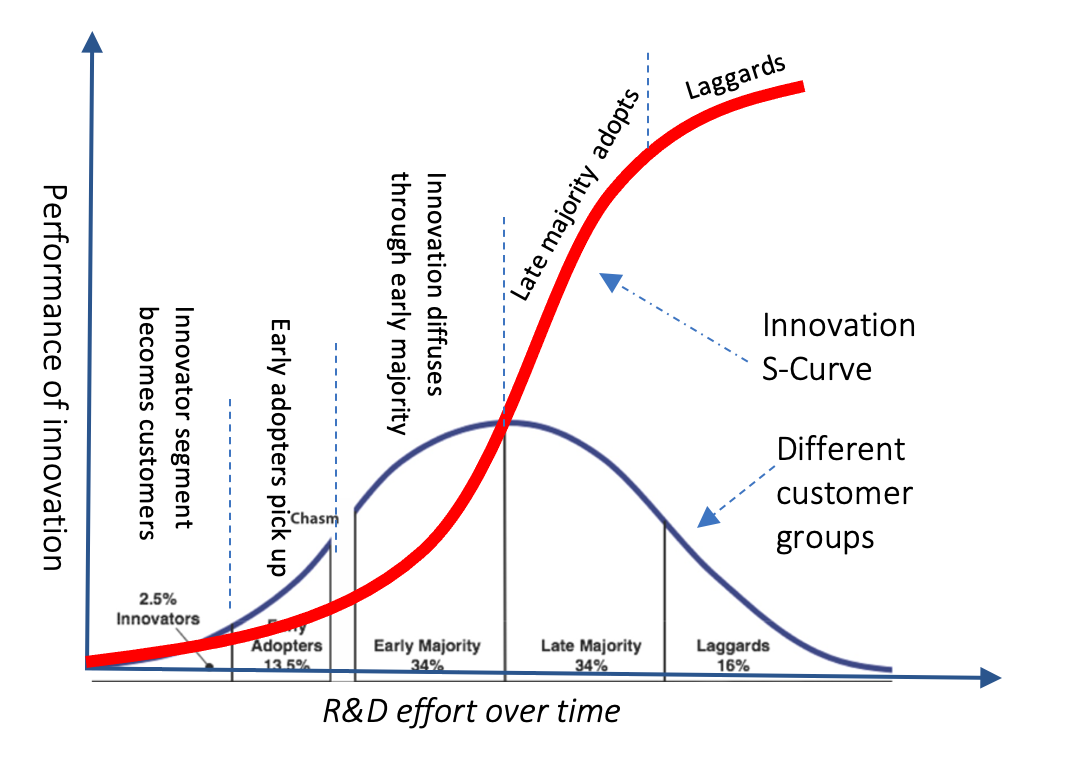
There should be a good synchronization between different stages of maturity and the requirements of different groups of customers. As opposed to a conventional understanding of innovation diffusion as a social phenomenon, technological innovation diffuses through various market segments due to its evolution. Innovation must keep improving for diffusing through subsequent market segments—as progressive waves. For example, the cell phone had to make a significant improvement in quality and cost to be adoptable by the farmers of Bangladesh. Hence, the diffusion of technological innovation through the trickle-down effect appears to be highly erroneous.
Underlying factors of evolution of innovation:
The question could be what it takes for the innovation lifecycle to evolve, improving quality and reducing cost. Invariably, the innovation S-curve demands a flow of ideas. The first source of the idea is the amenability of technology to progression. The following source is empathy. Innovators should feel the plausible unmet requirements and keep refining ideas to meet them by exploiting technology possibilities. The third source is about the positive Externality Effect stemming from 3rd party component plugins, infrastructure, etc. The 4th one is about the availability of complementary technologies supporting Incremental innovation. For example, the digital camera has made a significant contribution to the evolution of smartphones. And the last one is competition. In the absence of competition, innovations don’t grow. It’s the competition that keeps leveraging benefits from the previous factors in generating and implementing ideas–making innovation S-curve a reality.
Innovation S-curve unfolds as sustaining innovation strategy:
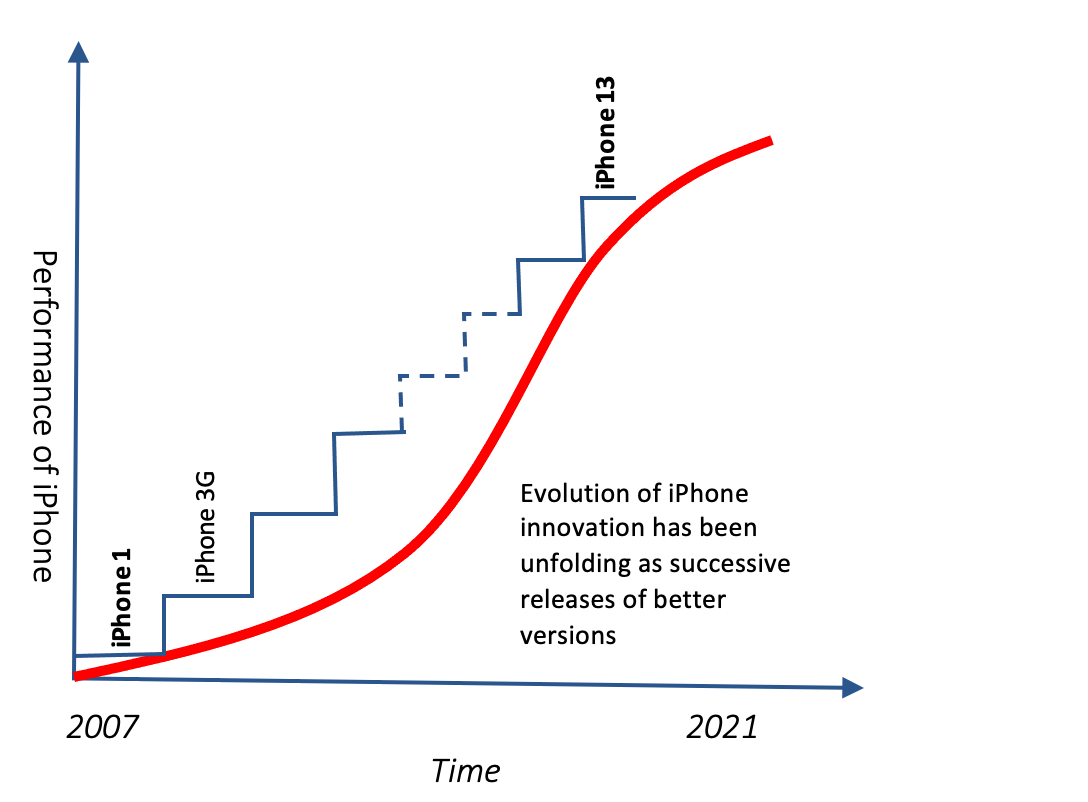
In a competitive market, the advancement of innovation unfolds as successive better versions. For example, within one year of the release of the iPhone 1, its sale came down to zero. Among the factors, the response of the competitors in the form of replication, imitation, and innovation are predominant. Furthermore, externality factors such as the 3G mobile internet emerged. Hence, Apple released the following versions by improving existing features, adding 3G, and many other features. Subsequently, competitors also responded with their improved versions. In response, Apple was compelled to release the next better version. This race of sustaining innovation in the competition space through successive better versions is a significant driver of innovation S-curve. Consequentially, the innovation lifecycle evolves through the release of successive better versions instead of continuous organic growth.
Discontinuity, Schumpeter’s creative destruction and disruptive innovation in innovation lifecycle:
As explained, at the maturity of the innovation S-curve, discontinuity shows up due to the reinvention dive. The matured technology core gets replaced with an emerging one, forming a reinvention wave. Subjective to the suitability of the underlying technology core, some of those reinvention waves grow as creative destruction, destroying the demand of products around the previously matured technology core. This is well-known for Schumpeter’s creative destruction. But sometimes, new entrants lead these waves, and due to decision dilemmas, managers of incumbent firms overlook them. Consequentially, incumbent giant firms fail to switch to new waves, suffering from the effect of disruptive innovation.
Hence, innovation S-curve is not about just evolution. Highly dynamic activities such as sustaining innovation, discontinuity, reinvention, creative destruction, and disruptive innovation keep unfolding the evolution of the innovation lifecycle in episodic form. In addition to improving innovation, it also allows new entrants to rise and force giants to disappear. Therefore, understanding of episodic evolution of the innovation lifecycle as a series of innovation S-curves is an essential management job.
Let’s recap:
In simple terms, innovation S-curve means fermentation, take off, and maturity of the evolution of innovation. But once we look into the episodic evolution of the innovation lifecycle as multiple innovation S-curves, we notice the presence of discontinuity caused by reinvention. Some of these reinvention waves grow as Clayton Christensen or disruptive S-curve, causing destruction to incumbent products and firms. As referred, there have been many examples of defining the evolution of products and industries as of innovation S-curves. Despite some limitations, the innovation S-curve forming an episodic model of the innovation lifecycle is a robust framework for analyzing various products and industries. It provides clues to interpret successes and failures and predict the future. Due to the effects of creation and destruction, the innovation lifecycle as successive S-curves is the underlying cause of Wealth accumulation and annihilation under capitalism.
...welcome to join us. We are on a mission to develop an enlightened community for making the world a better place. If you like the article, you may encourage us by sharing it through social media to enlighten others.



1 comment
Excellent web site you have here.. It’s hard to find quality writing like yours nowadays. I seriously appreciate individuals like you! Take care!!